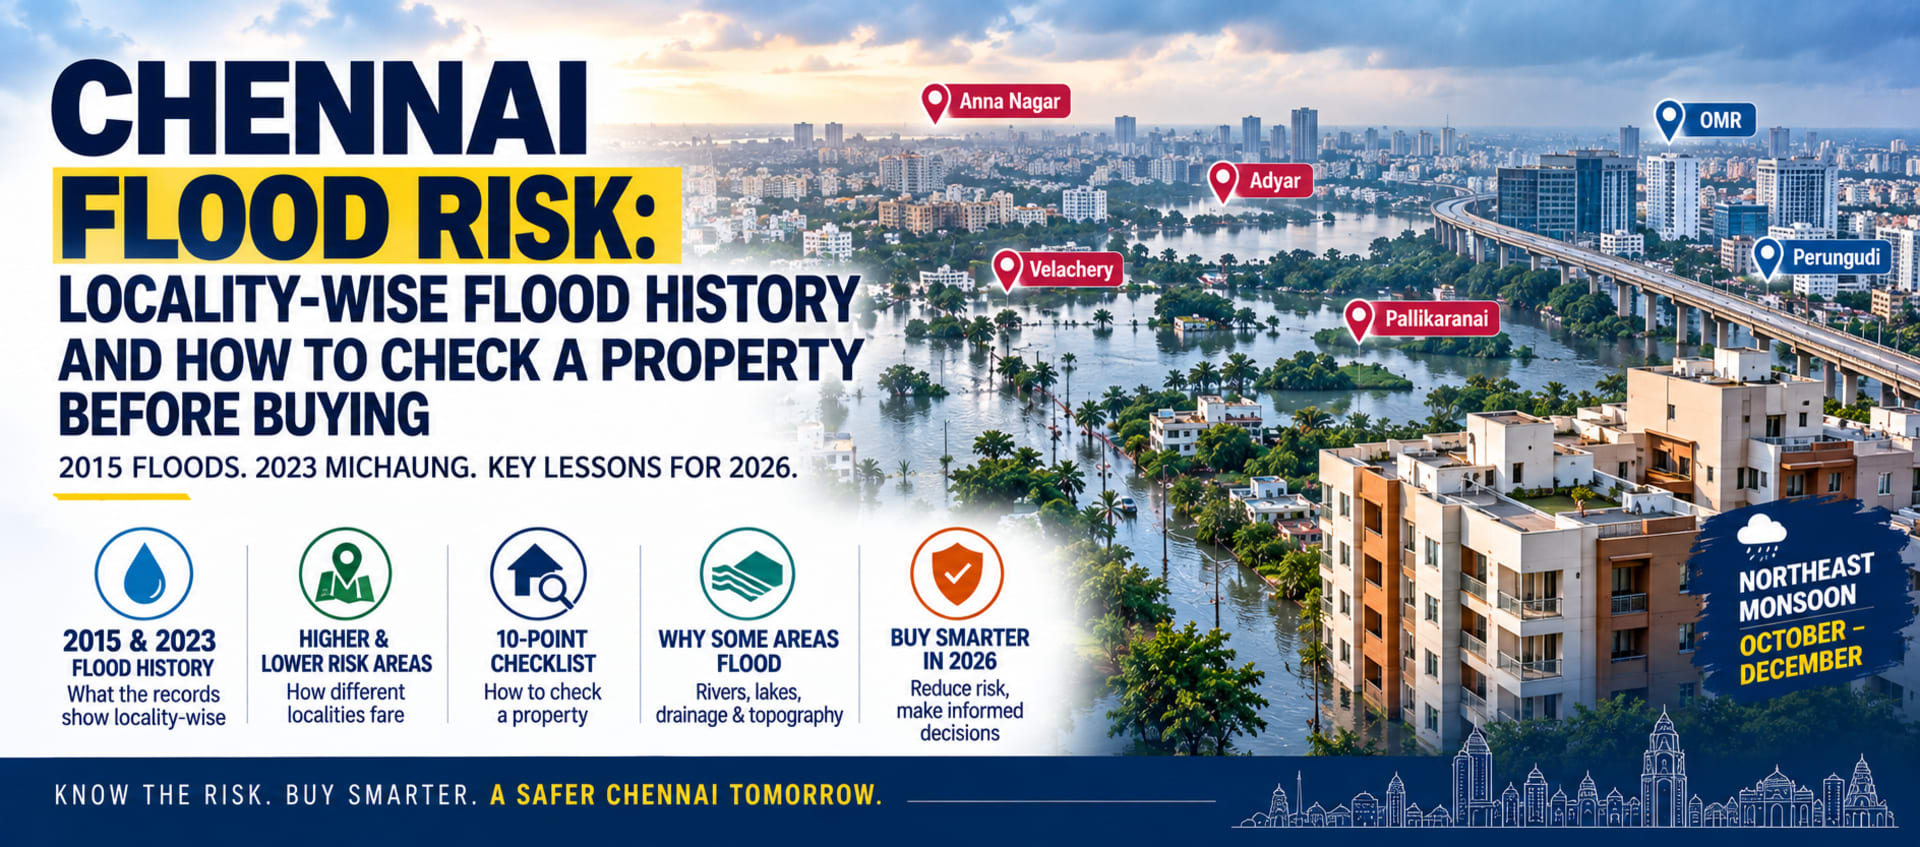
Chennai Flood Risk: Locality-Wise Flood History and How to Check a Property Before Buying
Chennai receives most of its annual rainfall during the northeast monsoon, from October to December, and two recent events — the 2015 floods and Cyclone Michaung in December 2023 — showed how unevenly that water is distributed across the city.
Two flats a few kilometres apart can have completely different flood histories. This guide explains why some parts of Chennai flood and others don't, what the 2015 and 2023 records show locality by locality, and, most importantly, how to check the flood risk of a specific property before you pay a token advance.
A note on "flood-free": No locality in a low-lying coastal city is guaranteed flood-free. What we can compare is documented historical inundation and relative exposure, based on flood observations, drainage characteristics and official flood-management information. Always check the specific street and building, not just the locality name.
Why Some Chennai Localities Flood and Others Don't
Chennai is flat, low-lying and coastal, and it drains through three major rivers — the Adyar, Cooum and Kosasthalaiyar — as well as the Buckingham Canal, wetlands, lakes and an extensive stormwater-drain network.
The Greater Chennai Corporation notes that the average land level of Chennai is only about 2 metres above mean sea level, making the city's flat terrain particularly vulnerable to water stagnation during intense rainfall and tidal conditions.
Flooding usually comes from a combination of four factors:
1. Former wetlands, lakes and low-lying land
Neighbourhoods around former marshes, lakes and water-retention areas can experience severe inundation when rainfall exceeds the capacity of the drainage network.
The Tamil Nadu Wetlands Mission describes the Pallikaranai Marsh as a major wetland and floodplain that drains a large part of South Chennai through outlets including Okkiyam Madavu and the Kovalam Creek.
2. River overflow
Localities along or close to the Adyar and Cooum can be affected when river levels rise rapidly.
During the 2015 floods, the Water Resources Department issued flood alerts along the Adyar after surplus water from Chembarambakkam reservoir was released into the river.
3. Wetland and drainage catchments
South Chennai contains the Pallikaranai marsh and its wider drainage catchment. Areas including Velachery, Pallikaranai, Perungudi, Madipakkam and Perumbakkam have been repeatedly discussed in official and technical flood assessments because of their relationship with this drainage system.
4. Stormwater-drain capacity and local topography
Flooding does not depend only on the name of a locality. The exact road elevation, drain gradient, connection to a larger channel, nearby waterbody and building level can make one street flood while another nearby street remains passable.
The Chennai Flood Monitoring System operated by the Tamil Nadu Government now uses rainfall, river, lake and reservoir observations and provides street-level inundation forecasts for vulnerable areas identified from historical flood events.
Locality-Wise Flood History: 2015 and 2023
The table below uses documented observations, rather than assigning a locality a flood label without evidence.
For the "Relative exposure" column, Higher documented exposure means the locality has evidence of significant inundation in both 2015 and 2023, or repeated evidence from authoritative/credible sources. It does not mean every street or property in that locality has the same flood risk.
Locality2015 floods2023 — Cyclone MichaungRelative exposureVelacheryNRSC/ISRO field assessment recorded approximately 4.5–5.5 ft of floodwater at surveyed locations, with water persisting for more than 10 days in parts of Velachery.Velachery was among the areas severely affected by Michaung; reports described persistent inundation and rescue operations.Higher documented exposurePallikaranai2015 flood mapping and subsequent technical/official records identify the Pallikaranai marsh and surrounding areas as part of the flood-inundation system; a hydrological assessment recorded approximately 3.05 m of waterlogging in the Pallikaranai marsh during the 2015 floods.Pallikaranai was among the most affected areas during Michaung, with prolonged water stagnation reported after the cyclone.Higher documented exposureMadipakkamNRSC/ISRO field data recorded approximately 1 ft of inundation at the surveyed Sabari Salai location, persisting for about 2 days.Madipakkam was reported as severely inundated after Michaung; rescue teams used boats to reach affected residents.Higher documented exposureTambaram / MudichurNRSC/ISRO recorded approximately 5.5 ft of floodwater at Mudichur, persisting for about 3 days.Mudichur was again waterlogged during Michaung, with residents requiring rescue and relief assistance.Higher documented exposurePerumbakkamA vulnerability assessment recorded residents reporting that 5–6 ft of the ground floor was submerged during the 2015 floods. Contemporary reporting also documented severe flooding in Perumbakkam.Perumbakkam was identified among the worst-affected areas during Michaung, with residents reporting prolonged loss of food, electricity and connectivity.Higher documented exposureAdyarNRSC/ISRO field data recorded approximately 1 ft at the surveyed Antariksha Vihar location. The wider Adyar river corridor experienced major flooding during 2015, with substantial inundation in nearby riverbank areas.Michaung affected parts of the wider Adyar area, although reporting also shows significant variation within the locality; some parts experienced much less waterlogging than nearby neighbourhoods.Variable; street-specific assessment essentialAnna NagarNRSC/ISRO recorded approximately 4.5 ft at a surveyed Venus Colony location, with floodwater persisting for about 7 days.Anna Nagar was listed among the affected areas following Michaung, and contemporary reports documented flooding and waterlogging in the neighbourhood.Higher documented exposureChromepetNRSC/ISRO recorded approximately 3.5 ft at the surveyed Radha Nagar location, with water persisting for about 3 days.Knee-deep water was reported in Chromepet during Michaung; the Chromepet Government Hospital was also affected by flooding.Higher documented exposureGuduvancheryGovernment rescue operations in December 2015 identified Guduvancheri among areas requiring flood rescue and relief operations. Contemporary reporting also documented severe flooding around Guduvanchery and surrounding marshland areas.Guduvanchery was affected during Michaung; reports documented inundation and relief operations in the Guduvanchery/Perumatunallur area.Higher documented exposurePadur (OMR)I have not found a sufficiently reliable locality-specific 2015 source in the sources reviewed to state a comparable flood depth or duration for Padur.The Indian Red Cross Society recorded distribution of relief materials to flood-affected people in Padur/Kelambakkam following Michaung.Evidence insufficient for a 2015–2023 comparison
Important interpretation
The table should not be interpreted as saying that every property in a "higher exposure" locality will flood.
For example, the 2023 reporting itself demonstrates substantial variation within the broader Adyar area. Likewise, a particular apartment may have a raised plinth, better drainage connection and higher parking level than neighbouring properties.
The correct question for a buyer is therefore:
"What happened at this specific property, street and surrounding drainage catchment during major rainfall events?"
rather than simply:
"Is this locality flood-prone?"
Sources
2015 flood evidence
National Remote Sensing Centre (NRSC), ISRO — "Chennai Floods, 2015: A Satellite and Field Based Assessment Study", published 2016. The report contains satellite-derived inundation maps and field observations including water depth and persistence for locations such as Velachery, Anna Nagar, Chromepet, Mudichur, Madipakkam, Adyar and other areas.
NITI Aayog — Tamil Nadu Flood 2015 report. The report documents the exceptional November–December 2015 rainfall, widespread inundation and overflow of the Adyar, Cooum and Kosasthalaiyar systems.
Press Information Bureau, Government of India — Army flood rescue updates, December 2015. These releases identify areas including Tambaram, Mudichur, Pallikaranai, Velachery, Guduvancheri and areas adjacent to the Adyar River among locations requiring rescue and relief operations.
Greater Chennai flood-management / technical records. Government and technical assessments identify the Pallikaranai marsh and surrounding drainage system as important components of South Chennai's flood behaviour.
2023 Cyclone Michaung evidence
Tamil Nadu Government — G.O. Ms. No. 604, Revenue and Disaster Management Department, 29 December 2023. Chennai, Tiruvallur, Chengalpattu and Kancheepuram were officially declared cyclone-affected districts following Cyclone Michaung.
Indian Express, 4 December 2023 — Chennai rainfall and inundation coverage. The report documents waterlogging in Chromepet, Tambaram, Velachery and Pallikaranai during Michaung.
New Indian Express, December 2023 — Michaung recovery and inundation reports. Reports documented continued severe inundation in parts of Velachery, Madipakkam, Adyar, Pallikaranai and other southern areas.
Sphere India Situation Report — Cyclone Michaung, 9 December 2023. The situation report identifies Pallikaranai, Tambaram, Anna Nagar and Velachery among the most affected areas and notes that Velachery and other areas remained underwater.
Indian Red Cross Society, Tamil Nadu — Disaster Management / Michaung relief records. The organisation records relief distribution to flood-affected people in Padur/Kelambakkam and other affected locations.
10-Point Flood Checklist Before You Buy
Whatever the locality, check these for the specific property:
1. Ask to see the site after heavy rain
Visit during or within a day of a heavy spell in October–December.
This is one of the most useful real-world checks because it shows how the street, entrance, parking and drainage actually behave.
2. Compare plinth height with the road
The ground floor and parking should sit comfortably above road level.
Road levels can increase over the years because of repeated resurfacing, while the building itself remains at its original level.
3. Check what the land used to be
Old revenue records and the patta/"A-register" classification can help identify whether the survey number was historically associated with a tank, eri, waterbody, poramboke or other land classification.
Ask your property lawyer to verify the records rather than relying on a broker's description.
4. Look at the nearest waterbody
Identify the nearest lake, marsh, canal or river.
Check its direction, elevation and drainage connection relative to the property.
The Tamil Nadu Wetlands Mission identifies the Pallikaranai Marsh as a major South Chennai drainage and flood-storage system.
5. Check the approval
For apartments, verify:
CMDA/DTCP approval
TNRERA registration
Approved building plan
Site plan
Basement/stilt configuration
Stormwater-drain provisions
Applicable waterbody/buffer restrictions
Our RERA verification guide explains the basic verification process.
6. Ask the neighbours and RWA
Ask long-term residents:
How high did water reach in 2015?
What happened in 2023?
How many days did water remain?
Did water enter the ground floor?
Was the basement flooded?
Was electricity disconnected?
Were residents evacuated?
Neighbour testimony should supplement — not replace — documentary evidence.
7. Check basement parking and electrical equipment
Find out where the following are located:
Basement parking
Electrical room
DG room
Transformer
Lift equipment
Fire pumps
A flooded basement can affect the operation of the entire building even when the apartment itself is above flood level.
8. Inspect the stormwater drains
Look at the actual street.
Ask:
Is there a drain?
Does it have an outlet?
Where does the water go?
Is the drain lower or higher than the road?
Does it connect to a canal/lake/main drain?
Is it blocked with silt or waste?
9. Check historical maps and satellite imagery
Look at historical satellite imagery and official GIS information where available.
The Tamil Nadu GIS platform provides layers for waterbodies, tanks, rivers, drainage and other geographic information.
10. Check insurance
Ask the insurer specifically whether the policy covers:
Flood
Inundation
Water damage
Basement damage
Electrical equipment
Do not assume that a standard home policy automatically provides every type of flood-related coverage.
Does Flood Risk Affect Property Prices?
Flood history can influence buyer demand, rental demand and resale discussions, but the effect is not uniform.
A locality can also change over time because of:
Stormwater-drain construction
Canal improvements
Lake restoration
Wetland protection
Road-level changes
New developments
Changes in surrounding land use
For example, the Greater Chennai Corporation reports continuing investment in integrated stormwater drainage, canal works and pond rejuvenation. Its current climate-budget documentation also records ongoing stormwater-drain and culvert projects across multiple zones.
Therefore, a 2015 flood record should not automatically be treated as a prediction of what will happen to a property in 2026.
At the same time, historical flooding should not be ignored simply because new drainage infrastructure has been constructed.
For current prices by locality, see our Chennai market data.
Buying in a Higher-Exposure Locality? Reduce the Risk
A locality with documented flood history is not automatically unsuitable for every property.
Consider:
Higher floors in apartments where appropriate.
Avoiding ground-floor units in particularly low-lying pockets.
Stilt parking instead of deep basement parking where feasible.
Electrical rooms and critical equipment positioned above potential flood levels.
A building plinth that is appropriately above the surrounding road.
Properly connected stormwater drainage.
Digital copies of all property documents.
Appropriate flood/inundation insurance coverage.
Most importantly, compare the individual property's elevation and drainage with nearby properties rather than relying only on the locality name.
A Better Way to Check a Property Before Paying a Token Advance
Before paying a token amount, create a simple property-level flood check:
Property address → Survey number → Elevation → Nearby waterbody → Drainage path → 2015 history → 2023 history → Building plinth → Basement → RERA/approval → Insurance
If several independent checks point in the same direction, the buyer has much stronger information than a generic "flood-free locality" claim.
Browse Properties by Locality
Locality Pages
Anna Nagar ·
Adyar ·
Chromepet ·
Guduvanchery ·
Padur
Last updated: 28 September 2026
Flood history is based on available government, technical and dated media sources. Historical flooding does not guarantee future flooding conditions at a specific property. Buyers should independently verify the property's street-level drainage, elevation, approvals and previous flood history before making a purchase decision.