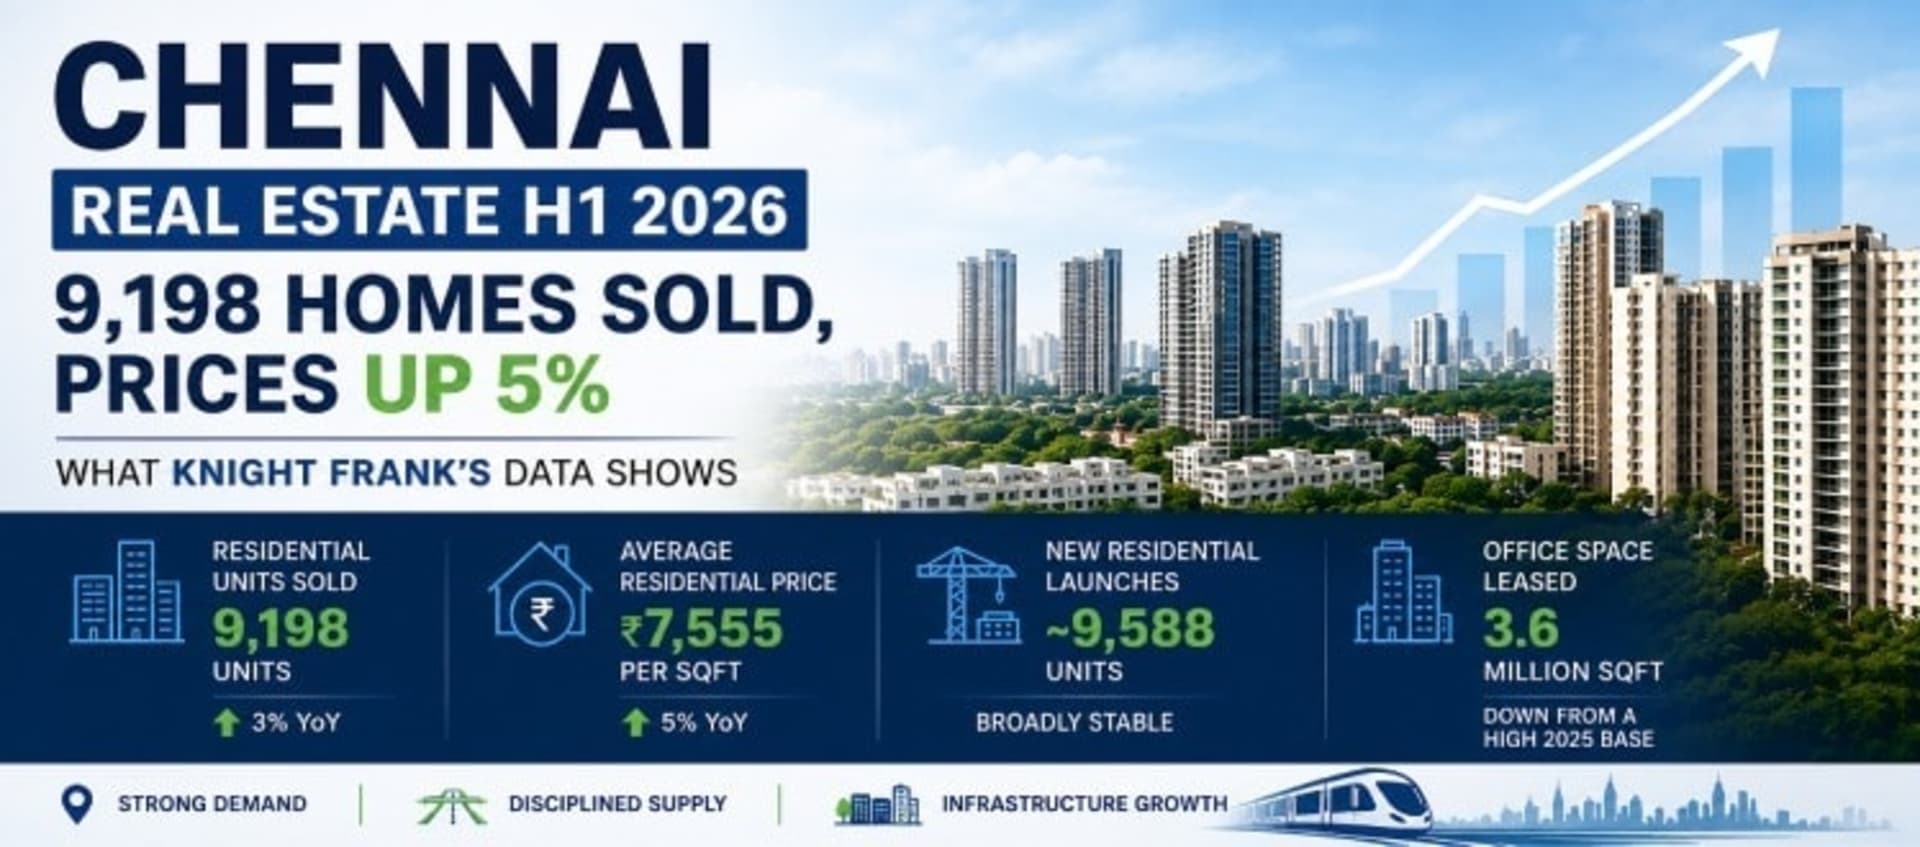
Knight Frank's H1 2026 report shows Chennai sold 9,198 residential units (+3% YoY) at an average price of ₹7,555 per sqft (+5% YoY), while new launches held broadly stable at roughly 9,588 units. The office market leased 3.6 million sqft, down from an unusually strong 2025 base but still a solid first-half figure, with GCCs the dominant occupier category.
Quick answer: Chennai's H1 2026 housing market grew steadily rather than dramatically — 9,198 units sold (+3% YoY) at ₹7,555/sqft average (+5% YoY), per Knight Frank India. New launches (~9,588 units) stayed broadly stable, a sign developers aren't flooding the market. Demand is reportedly shifting toward mid and premium segments, attributed to infrastructure expansion, Global Capability Centre (GCC) and manufacturing employment growth, and improving connectivity including Chennai Metro Phase 2 — though Knight Frank's commentary doesn't specify an exact price-band split. The office market leased 3.6 million sqft, still strong historically despite a year-on-year dip from 2025's peak, with GCCs remaining the leading occupier category. Buyers should favour projects with genuine location and delivery-track-record differentiation over speculative new launches.
The Headline Numbers
Knight Frank India's H1 2026 residential market report puts Chennai's performance for the first half of the year at:
MetricH1 2026YoY Change Residential units sold9,198 units+3% Average residential price₹7,555 / sqft+5% New residential launches~9,588 unitsBroadly stable Office space leased3.6 million sqftDown from a high 2025 base
Source: Knight Frank India, "India Real Estate: Office and Residential Market — H1 2026." Cross-referenced with Cushman & Wakefield's Chennai MarketBeat for the office-leasing figure.
Sales Growth Is Real, But Modest
A 3% year-on-year rise in units sold is steady rather than dramatic — Chennai isn't in a boom, but it also isn't slowing down. Combined with a 5% rise in average price per square foot, the data points to a market where demand is keeping pace with (and slightly ahead of) new supply, rather than one where either buyers or developers are pulling back.
Supply Has Stayed Disciplined
New launches at roughly 9,588 units were reported as "largely stable" — developers adding new stock at a measured pace rather than flooding the market. That kind of disciplined supply is generally a healthier signal than either a launch drought (which pushes prices up faster than incomes) or an oversupply glut (which depresses prices and stalls existing inventory).
Demand Is Shifting Toward Mid and Premium Homes
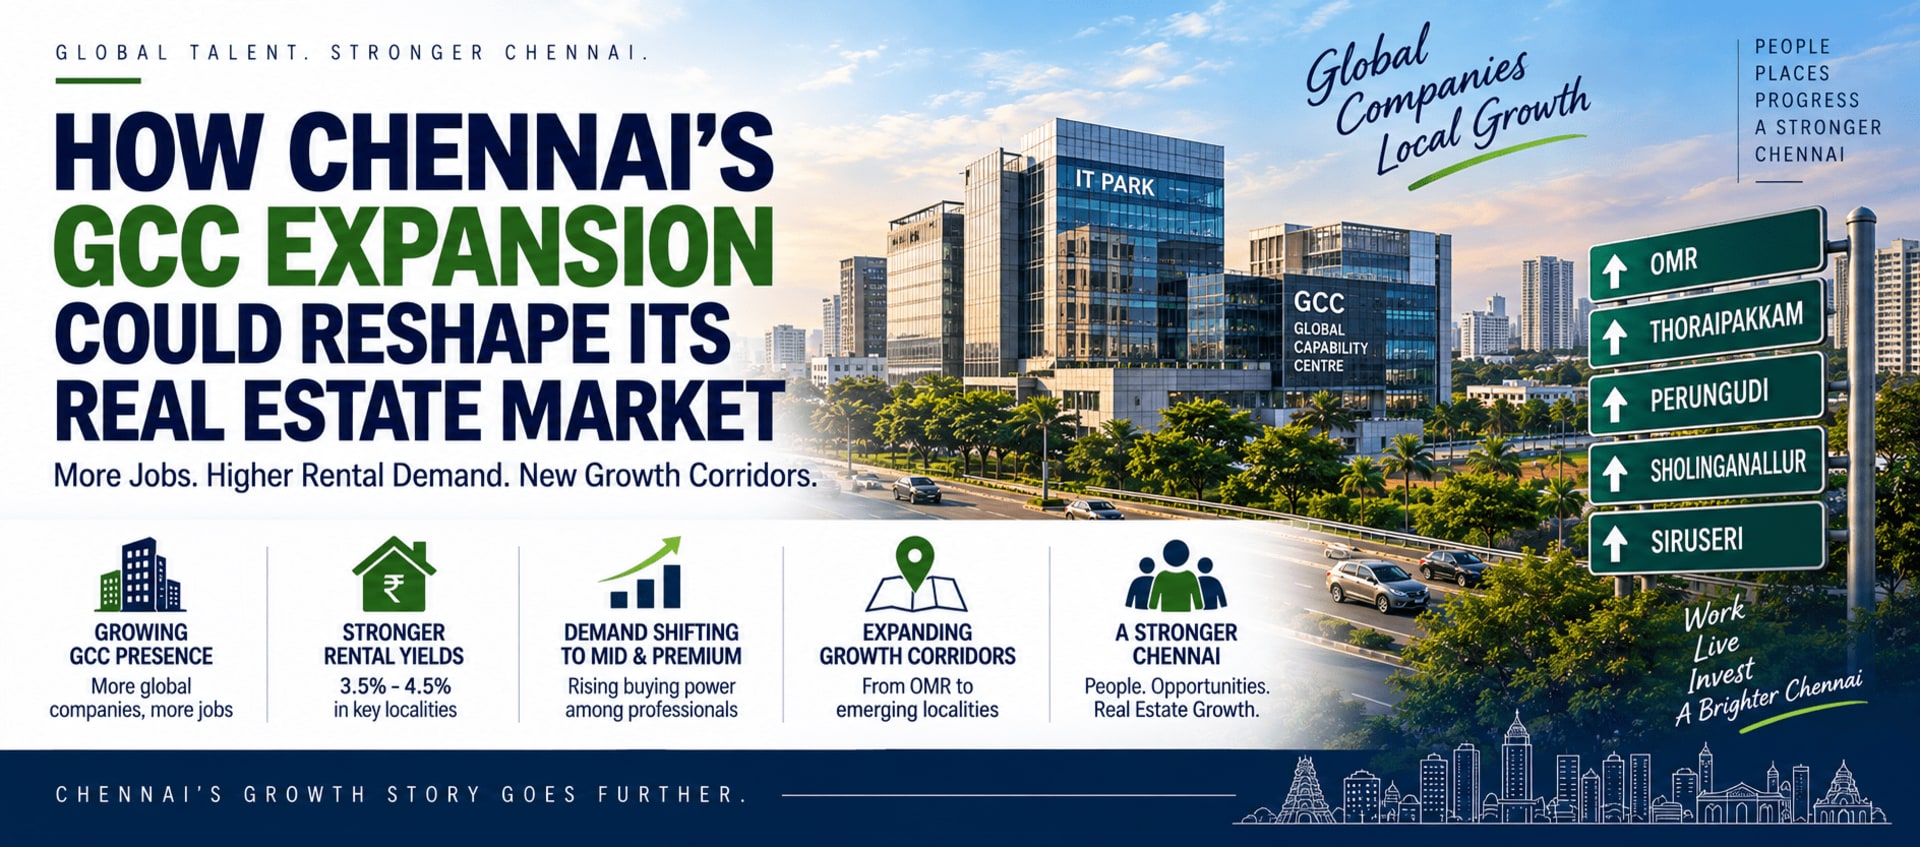
Knight Frank's commentary on the H1 2026 data describes demand continuing to shift toward the mid and premium housing segments, attributing this to infrastructure expansion, employment generation across manufacturing and Global Capability Centres (GCCs), and improving connectivity — including, explicitly, Chennai Metro Phase 2. We haven't independently verified an exact price-band sales split for this report, so we're stating the directional shift as reported rather than quoting a specific percentage breakdown we can't confirm.
The Office Market: A More Complicated Story
Chennai's office market leased 3.6 million sqft in H1 2026 — a strong first-half figure historically, even though it represents a year-on-year decline against an unusually high 2025 base. Global Capability Centres (GCCs) remained the dominant occupier category, and office completions reportedly surged sharply over the period, meaning more finished, leasable space entered the market even as leasing volumes normalized from 2025's peak.
What This Means If You're Buying or Investing
Price growth is steady, not runaway — a 5% YoY rise is a reasonable, sustainable pace rather than a signal to rush in fearing you'll miss a spike.
Supply discipline favours existing projects with genuine differentiation (location, RERA-clean approvals, delivery track record) over speculative new launches chasing volume.
GCC and manufacturing employment growth is the demand engine analysts are pointing to — which favours localities with strong connectivity to IT/GCC clusters and industrial corridors, consistent with what the Metro Phase 2 data above also suggests.